Data assets.
Exclusive Data That Transforms Technology Big Data into Profitable Web Services and Business Models
Big Data Assets for Optimal Reallocation of Innovation Resources
PatentPia isn’t just another database — it’s a powerhouse of global patents, research papers, and GitHub software data. More importantly,
it refines this raw information into unique, high-impact data assets designed
to drive next-generation web services and business innovations.
This unique data can be used to implement specialized business models targeting various niche markets.
Patentpia Data Map
Unique data that enables differentiated services and business
PatentPia's global patents, papers, and GitHub SW for
i) foundational data, ii) quantitative analysis data, iii) relationship analysis data, iv) classification data, and v) data for linking with disparate data.
Please refer to the following data
characteristics for quantitative analysis data, relationship analysis data, and classification data.

Data features
The Big Three Data Features: Counting, Relationships, and Classification
We meticulously refine the data to conveniently extract the most comprehensive information on innovation assets such as
companies, technologies, individuals, and patents. Check out the sample screen below.
Metric data
PatentPia has been building a massive metric-based big data infrastructure, covering:
i) over 3 million companies, universities, and research institutions
ii) over 90 million inventors
iii) over 5 million technologies,
iv) over 200 million company-specific technologies, and
v) over 200 million inventor-specific technologies — all analyzed through key patent indicators.
GoldenCompass, the core platform powered by PatentPia’s data, is designed to extract and deliver the most diverse and detailed quantitative insights on innovation assets. For instance, you can explore deep-dive patent metrics for highly specialized companies focused on fields like AI semiconductors.
For a single input — such as a company, technology field, or keyword — over 100 types of analytical results are delivered using metric-based data. These metrics are organized across an intuitive, multi-depth menu structure (Depth 1 to 4).
The data includes a wide range of quantitative views, such as:
i) time-series metrics,
ii) rights-holder-specific metrics (e.g., companies),
iii) inventor-specific metrics,
iv) technology-specific metrics (e.g., by keyword or IPC/CPC classification),
v) event-specific metrics (e.g., transactions, lawsuits, trials), and
vi) individual patent-level metrics.
Each metric is mapped to a Depth 1 menu item, allowing users to explore a rich and detailed data experience. Each menu directly corresponds to specific business intentions within the tech information industry.
Users can simply click the menu that matches their intent — no complex operations required. The platform delivers relevant metrics instantly, making data exploration seamless and purpose-driven.
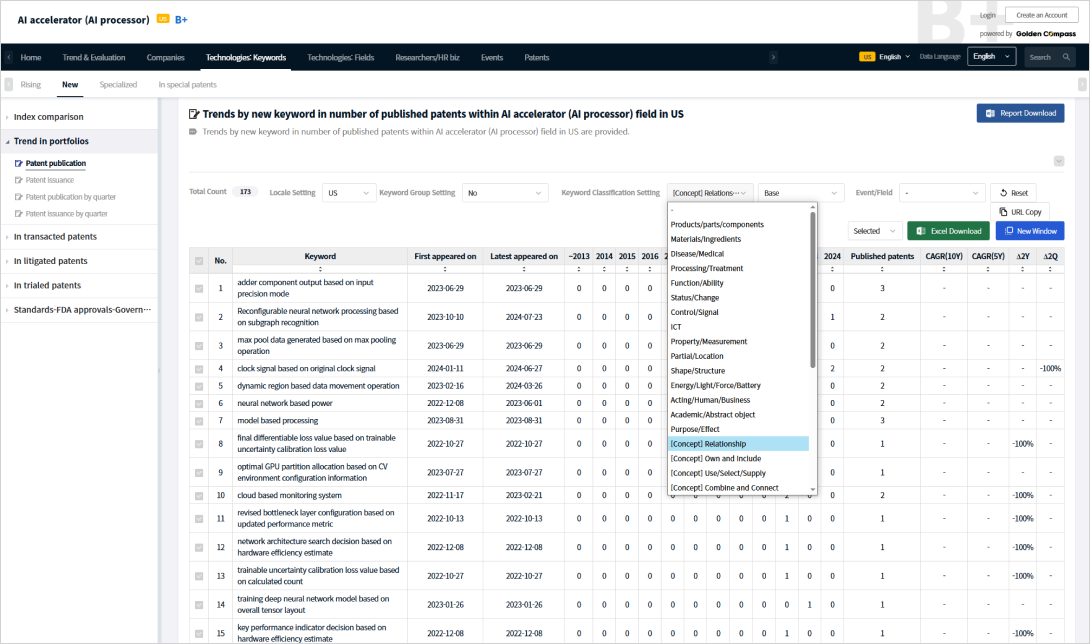
Example Web Interface: Meteric data
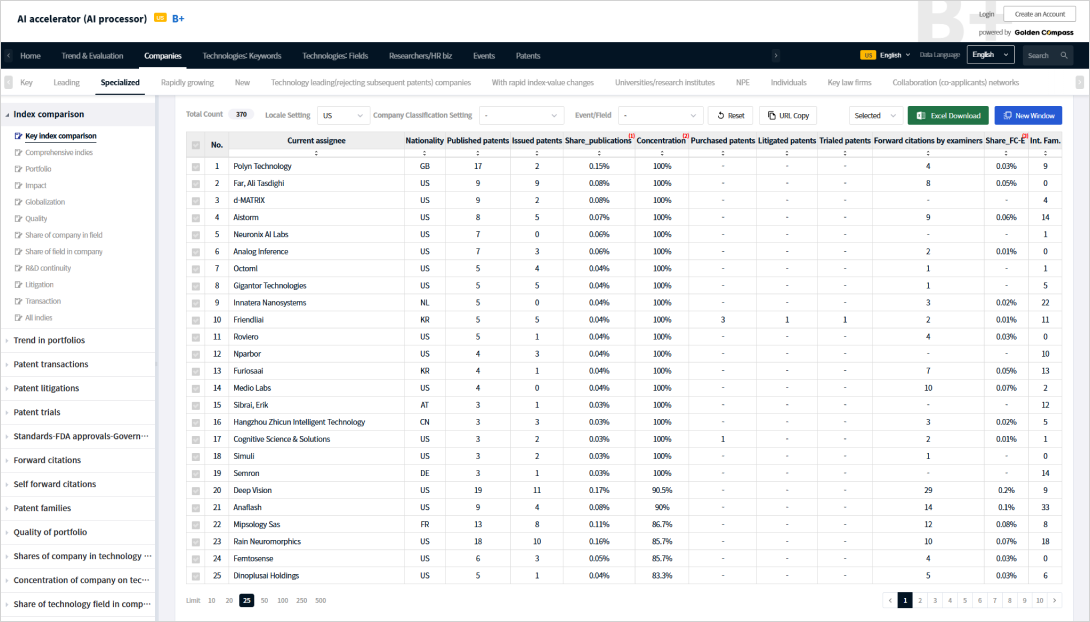
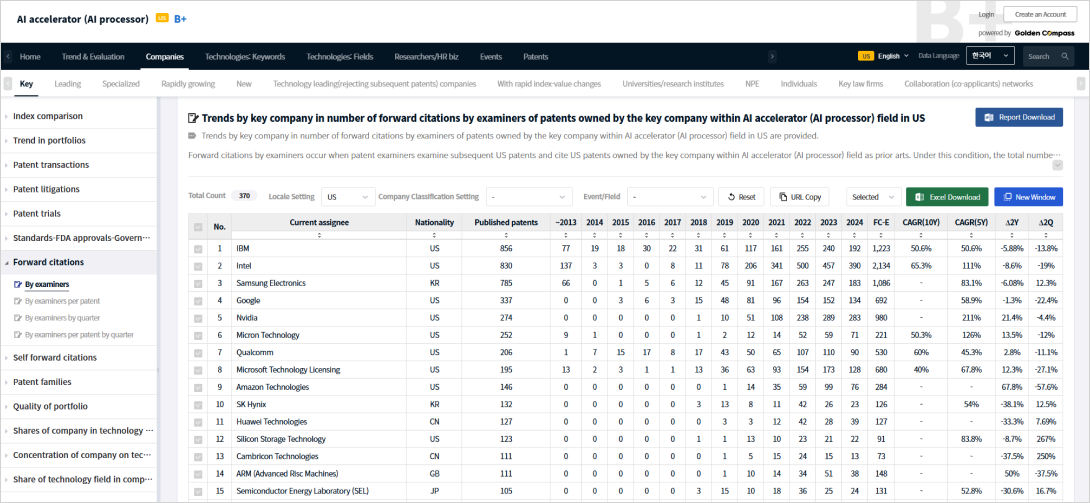
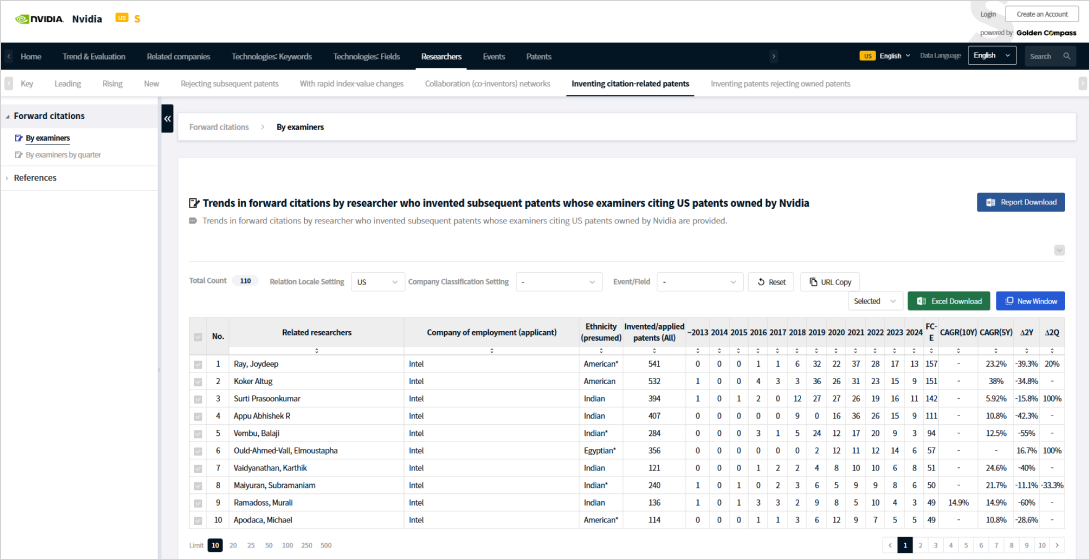
Using PatentPia’s quantitative analytics, you can compare the patent technology competitiveness of key players in a specific field (e.g., AI accelerators) based on the number of citations their patents have received from patent examiners — a strong indicator of technological impact.
1 depth offers 1) Trends, 2) Companies, 3) Technology Keywords, 4) Technology Fields, 5) Researchers, 6) Events, and 7) Patents.
For the 1 depth Companies menu, the 2 bdepth menu offers 7 categories from 1) Key Companies … 7) Collaboration Networks.
2 depth for the key companies menu, 3 depth menu offers 1) Metrics, 2) Trends, 3) Transactions, 4) ...7) Forward Citation, ...
For the 3 depth Forward Citation menu, 4 depth menu offers 1) Forward Citation by examiners,
Relationship data
PatentPia has constructed an extensive relationship big data infrastructure that maps key patent-based connections — such as citations, rejections, transactions, and legal disputes (patent
litigations and trials — across
These relationship data points are generated from interactions between {companies, people, technologies of companies, technologies of people} and {companies, people}.
i) companies, universities, and research institutions,
ii) individual inventors, and
iii) technologies held by companies and inventors.
GoldenCompass makes these diverse relationship datasets easily accessible through the web.
For example, you can analyze the number of trailing U.S. patents held by companies that were rejected
during patent examination — specifically due to prior patents owned by highly specialized companies in the AI semiconductor sector
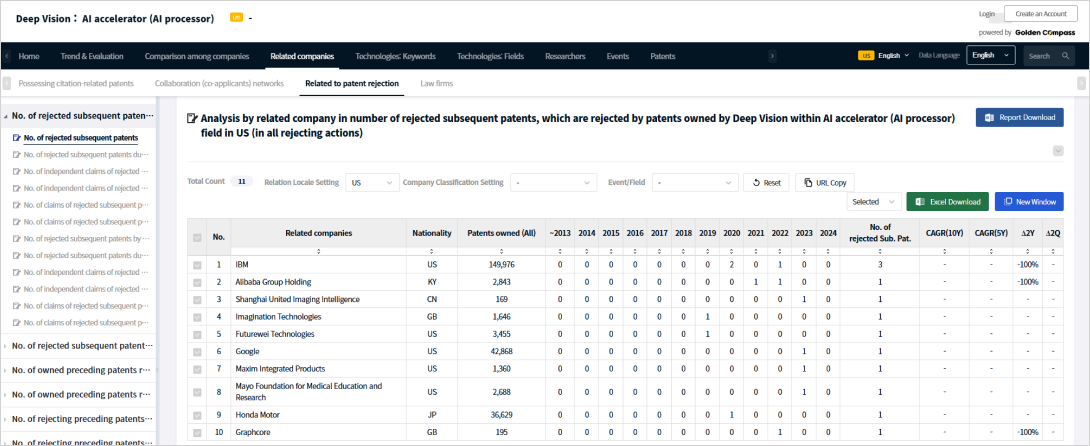
These relationship data can be leveraged across a wide range of business scenarios, including technology company IR, M&A and investment sourcing, and licensing target discovery.
When you click on any innovation asset (such as a company, individual, technology, or patent), GoldenCompass reveals a web of related assets. These connections represent classic network relationships
Examples of network relationships include:
i) patent citations,
ii) patent rejections,
iii) patent acquisitions or licensing deals,
iv) disputes such as lawsuits or trials,
v) co-applications or co-inventorships, and
vi) M&A or investment activities.
These networks open the door to powerful business models. Objective, data-driven insights can support technology valuation, investor relations, licensing negotiations, and strategic M&A or fundraising initiatives. Related patents can be targets for acquisition or licensing,and the inventors behind those patents can inform HR strategies and talent scouting.
For instance
A company that owns the most frequently cited prior patents in a specific technology field could be a prime M&A or investment target.
Inventors with the most prior patents that have led to rejections of a specific competitor’s patents can be crucial leads for talent acquisition.
Companies from a specific country whose patents frequently cite a particular company’s patents can be strong candidates for IP licensing or partnerships.
Example Web Interface: Relationship data
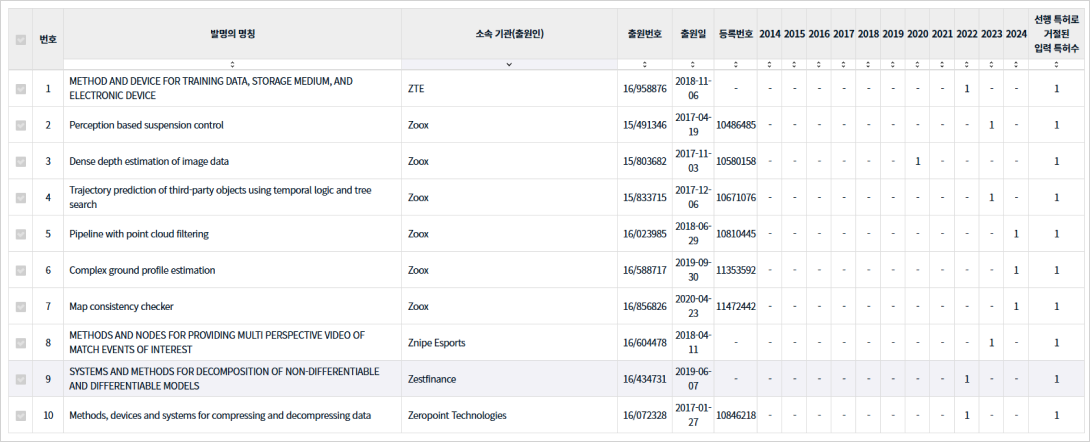
We aim to identify innovation assets that may be of strategic interest to Nvidia by leveraging PatentPia’s relationship data.
Specifically, we analyze the inventors who created the prior patents most frequently cited by Nvidia’s U.S. patent portfolio.
The prior patents that have most frequently caused the rejection of Nvidia's patents in the AI accelerators field.
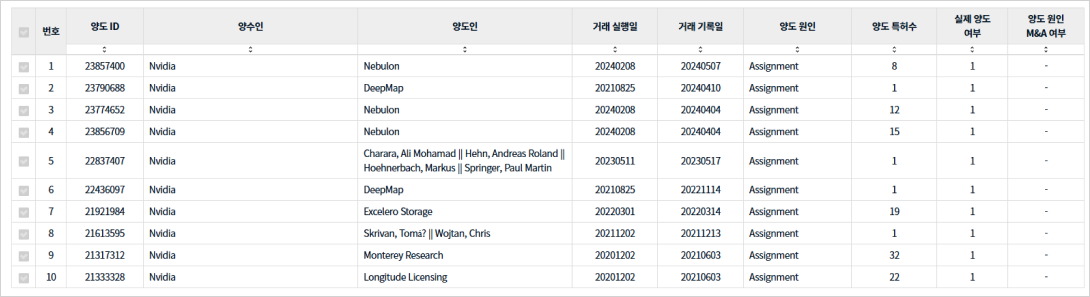
Nvidia's patent purchase network
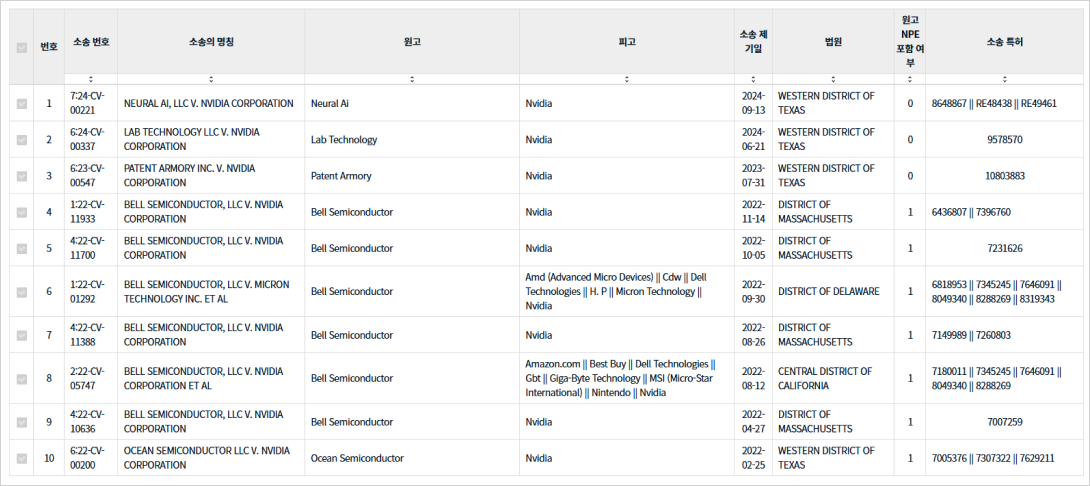
Nvidia's patent litigation network
Classification data
PatentPia offers one-click access to high-impact keyword insights across innovation assets — including companies, technologies, individuals, and patents. These keywords include fast-growing terms and newly emerging concepts. Moreover, each keyword is classified into a two-level hierarchy of over 200 categories, such as product/component (e.g., battery components), material/substance (e.g., polymer materials), disease/medical, processing/treatment (e.g., bonding), function/action (e.g., heating), and control.
For deeper semantic understanding, PatentPia also provides more than 100 conceptual classifications.
For example: The keyword “location-based advertisement” is categorized under the
concept “relation → based-on”. The keyword “cobalt-free active electrode” falls under the concept “relation → absence”. These conceptual classifications are applied even to the most cutting-edge
data — such as newly emerging keywords within AI semiconductor patents, which appeared in the field for the first time within the past two years.
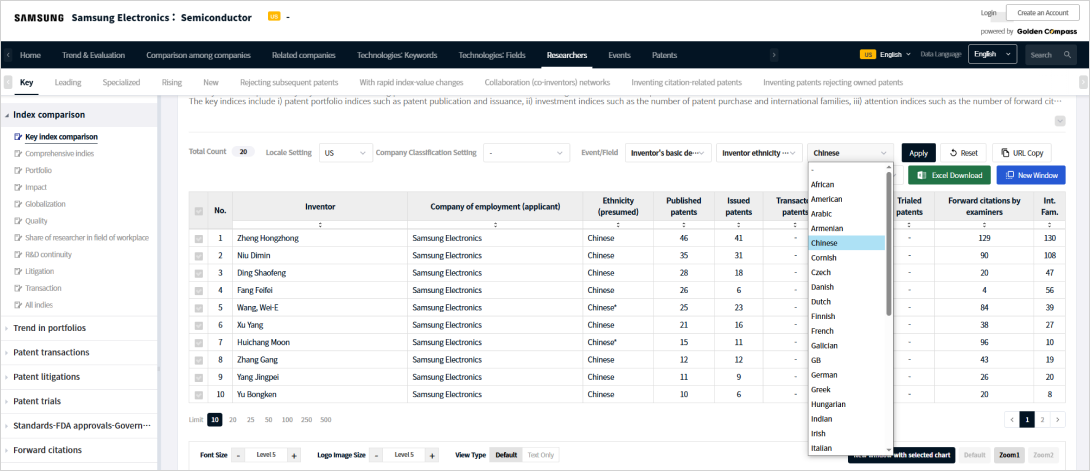
Ethnicity classification of inventors can be effectively utilized in HR and talent acquisition strategies.
Additional classification types include stock market segments for companies and NPE (Non-Practicing Entity) identification.
By using classification data as filters, users can extract highly targeted and specialized data sets.
For details on PatentPia’s keyword classification system, please refer to the linked webpage.
For a full overview of our diverse classification datasets, check the following link:Link to classification data.
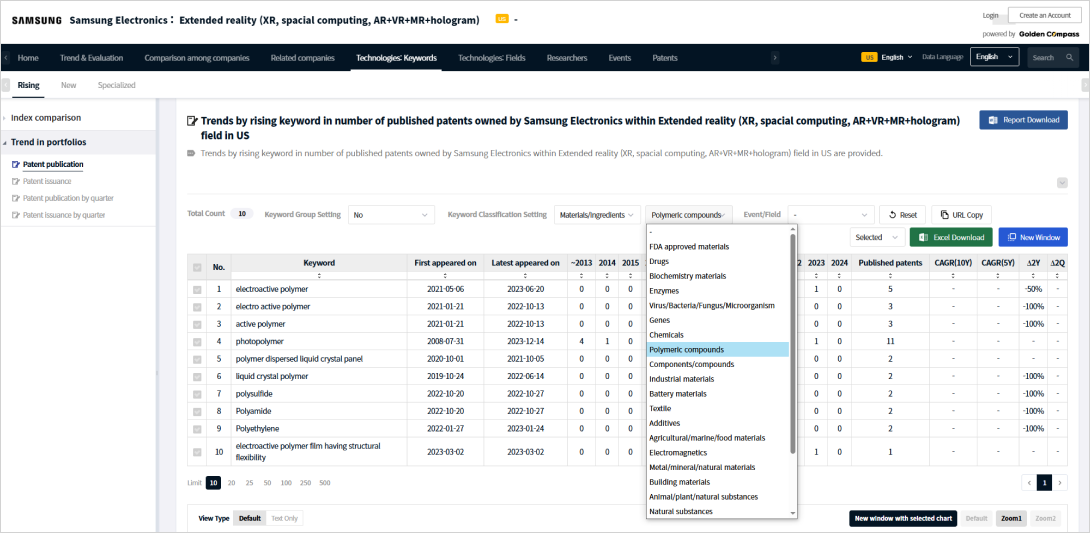
Example Web Interface: Classification data
By leveraging PatentPia’s classification datasets — such as keyword classification and inventor ethnicity — big data can be refined and applied more precisely to fit specific objectives.
Among the fast-growing and newly emerging keywords found in Samsung Electronics’ U.S. patents in the XR (extended reality) field, which ones relate to polymer materials/substancesLink to classification data.
Which Nasdaq-listed companies with prior art patents are rejecting the most Nvidia-owned US patents
Which Nasdaq-listed companies with prior art patents are rejecting the most Nvidia-owned US patents?
For a detailed introduction to the PatentPia data, see the webpage that follows the link
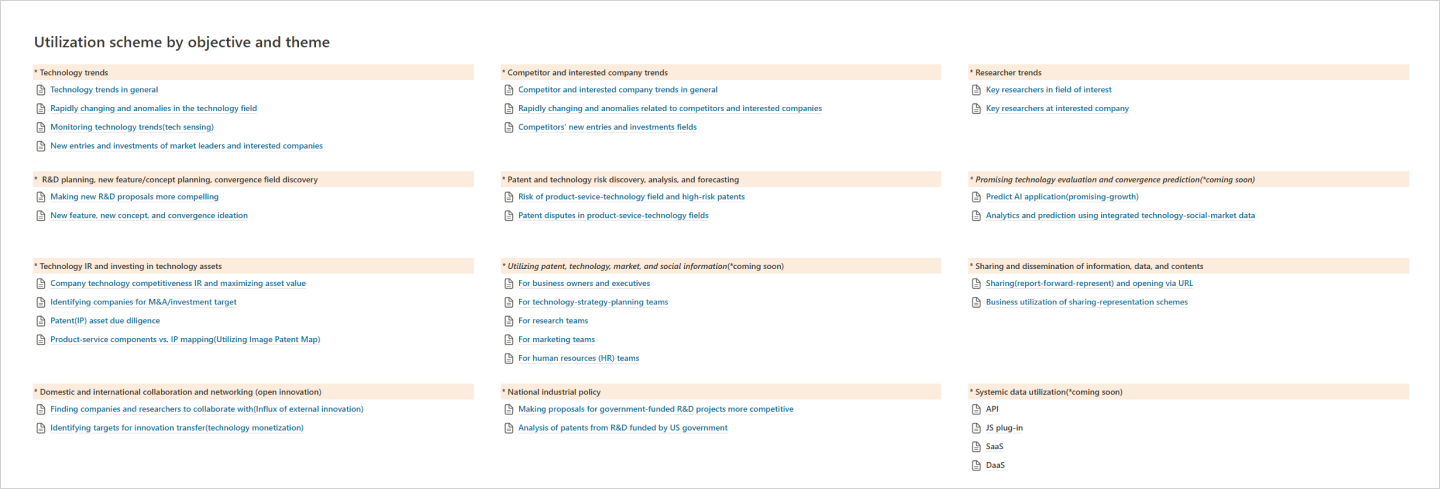
Data utilization Framework
Purpose–Theme–Topic-Based Data Utilization Structure
Purpose–Theme–Topic-Based Data Utilization Structure PatentPia’s global technology data is structured to support a wide range of purposes, contexts, themes, topics, and user needs. The examples below illustrate representative utilization frameworks
On the web page that opens via the link, explore the items categorized by development purpose, theme, and topic. Link →
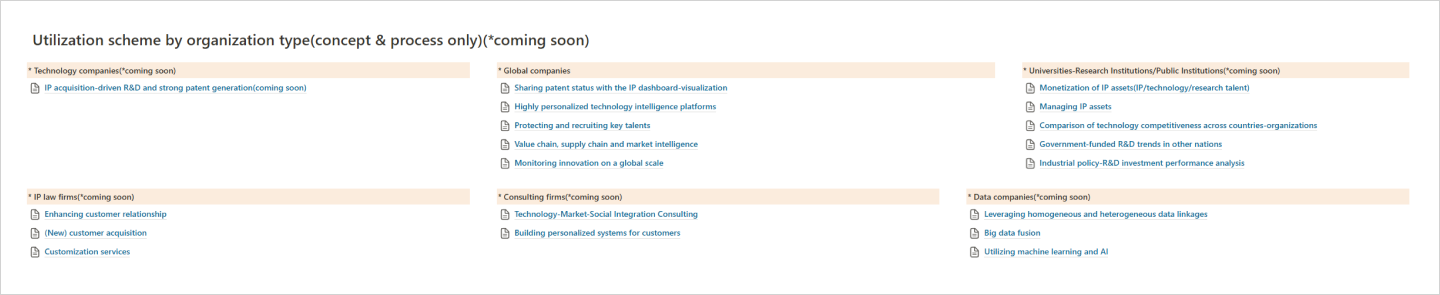
Utilization Framework by Organization Type
PatentPia’s global technology data can be effectively applied to the workflows of various organization types — including global corporations, universities and research institutes, and IP law firms. Link →
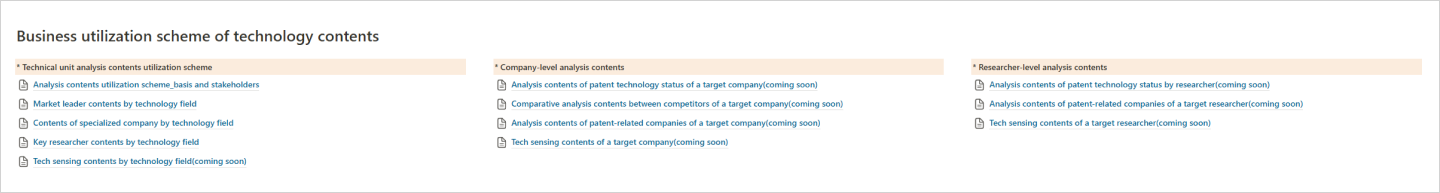
Technology Content Business Utilization
PatentPia’s global technology data can also be leveraged in technology content businesses to drive insights, engagement, and innovation. Link →