

Service.
A service that provides analytical data on patent-holding companies, inventors,
and technologies around the world, as well as insights into the relationships among them.
PatentPia's current services
for optimal reallocation of technology innovation assets
PatentPia delivers the full potential of patent big data at your fingertips.
With just one click, you can access a wealth of insights on selected targets—whether it's a specific technology field,
company, inventor, or a company's technological portfolio.
Our platform also provides one-click relationship analysis between these entities, helping you uncover hidden connections and strategic opportunities.
The current PatentPia web service showcases
how patent big data can be applied in real-world business contexts. We invite you to experience a unique, business-driven approach to global technology intelligence.
Imagine what's next—whether it's an advanced extension of PatentPia or an entirely new service powered by patent big data and AI. The possibilities are yours to explore.
Service map
A service that transforms a single input into a wide array of rich, insightful outputs
GoldenCompass (goldencompass.patentpia.com), one of PatentPia’s flagship services,
delivers a wide range of outputs from a variety of inputs—maximizing insights and value from every query.
Please refer to the illustration below.
link to example screen →

GoldenCompass (https://goldencompass.patentpia.com/en) a flagship service of PatentPia, transforms four key types of input into deep, data-driven insights that reveal critical patterns and connections.
1. Technology themes (keywords, classifications like CPC),
2. Organizations (companies, universities, research institutes),
3. Experts (inventors and technical personnel), and
4. Technologies linked to organizations or individuals.
For each input, GoldenCompass delivers rich, data-driven analysis and compelling visual content—all in one click.
Service features
Three Key Service Features: Diversity, Interconnectivity, and Convenience
It maximizes information extraction on the subject, establishes interconnections between data points,
and integrates various convenience features to enhance user experience.
Diversity
of Menus
PatentPia GoldenCompass is committed to extracting the maximum amount of information.
For a single input (e.g., technology keywords, companies, etc.), more than 100 types of analysis results are provided as independent menu items (ranging from 1st to 4th depth levels).
As a result, a rich variety of menus is available. Each menu is precisely matched to the diverse objectives of users in the technology information industry.
By selectively using (or expanding/creating) GoldenCompass’s diverse menus according to different purposes, it is possible to build multiple independent specialized web sites. For example, one could create a site that supports HR services focused on technical talent, or a site dedicated to evaluating and analyzing technology companies for investment and M&A opportunities
For instance, if talent acquisition in the AI semiconductor sector is required, users can easily discover highly specialized researchers or rapidly-growing inventors (through the "rising researchers" menu — see screen below) by simply clicking on the relevant menu.
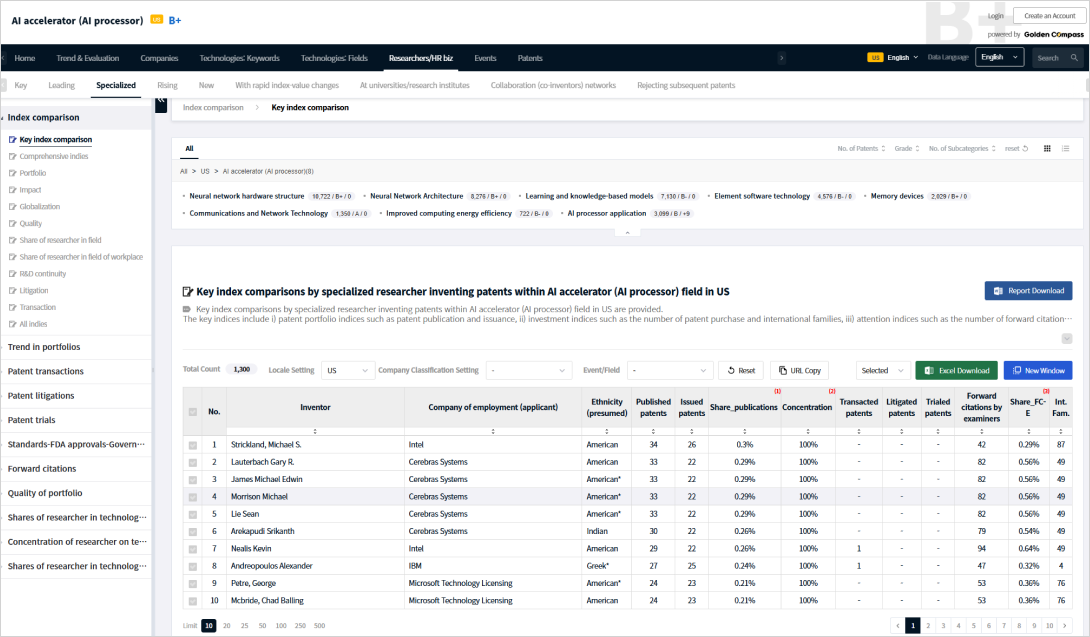
Diversity of Menus Example Screens
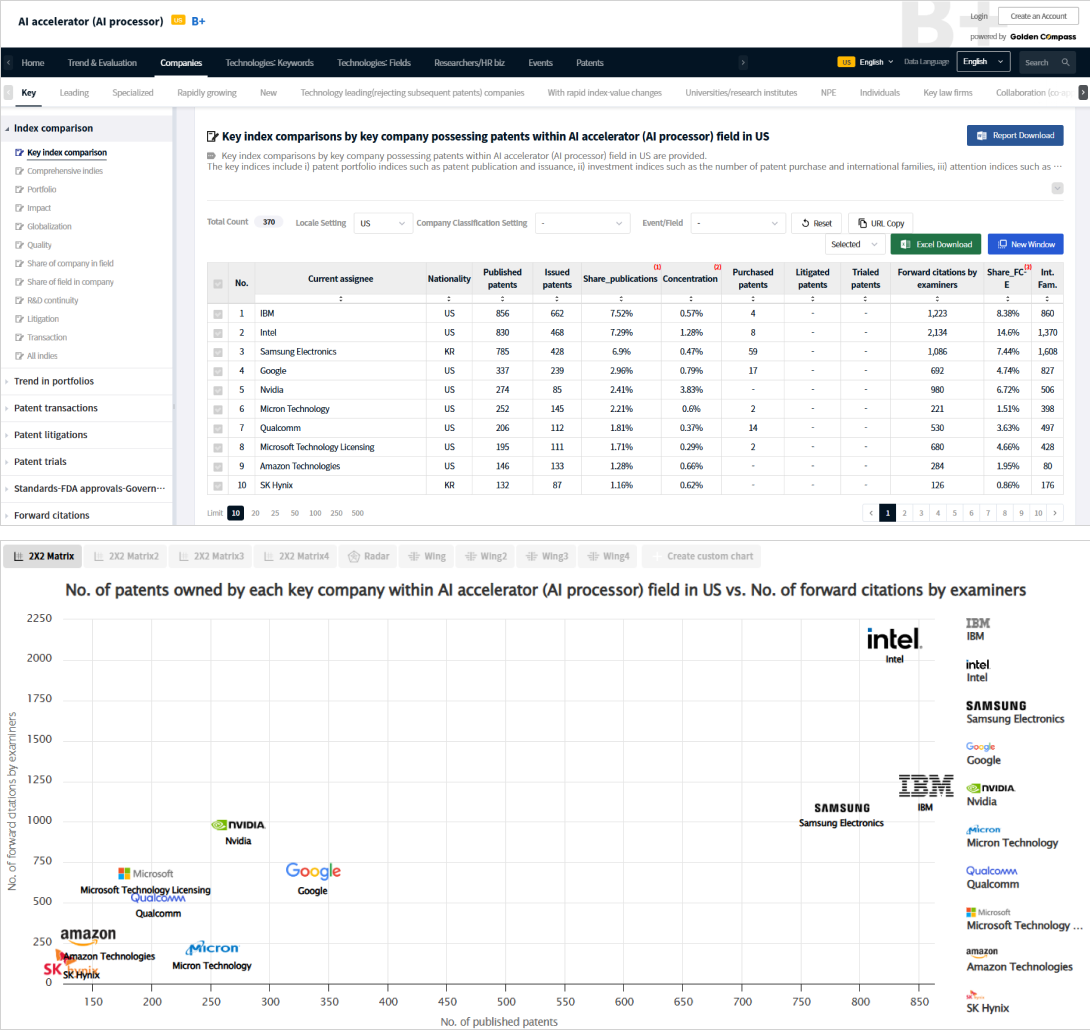
* Based on a given input (e.g., AI semiconductors), the system compares and analyzes the patent technology competitiveness among leading companies in the field by evaluating the number of citations each patent received from patent office examiners.
At the 1st-depth menu, seven categories are available: (1) Trends, (2) Companies, (3) Technologies: Keywords, (4) Technologies: Fields, (5) Researchers, (6) Events, and (7) Patents.
For the 1st-depth "Companies" menu, seven types of 2nd-depth menus are provided, such as (1) Leading Companies up to (7) Collaboration Networks.
For the 2nd-depth "Leading Companies" menu, various 3rd-depth menus are offered, including (1) Indicators, (2) Trends, (3) Transactions, (4) ... (7) Forward Citations, etc.
For the 3rd-depth "Forward Citations" menu, additional 4th-depth menus such as (1) Citations by examiners, and others are available.
Interconnectivity Between Information
GoldenCompass offers maximum interconnectivity.
By clicking on any item displayed in the output (such as companies, individuals, technologies, or patents), the selected item becomes a new input, generating a variety of new outputs.
This powerful connectivity enables continuous analysis and re-analysis. As a result, users can keep exploring intuitively without interruption, making it easier to uncover deeper insights.
For example, in the AI semiconductor field, you may want to analyze with whom Kale, Poorna — the top-ranked fast-growing researcher — has collaborated to invent patents in this area.
In this case, simply click on Kale, Poorna, then navigate from "1st-depth related researchers" to "2nd-depth collaborating researchers (co-inventors)."
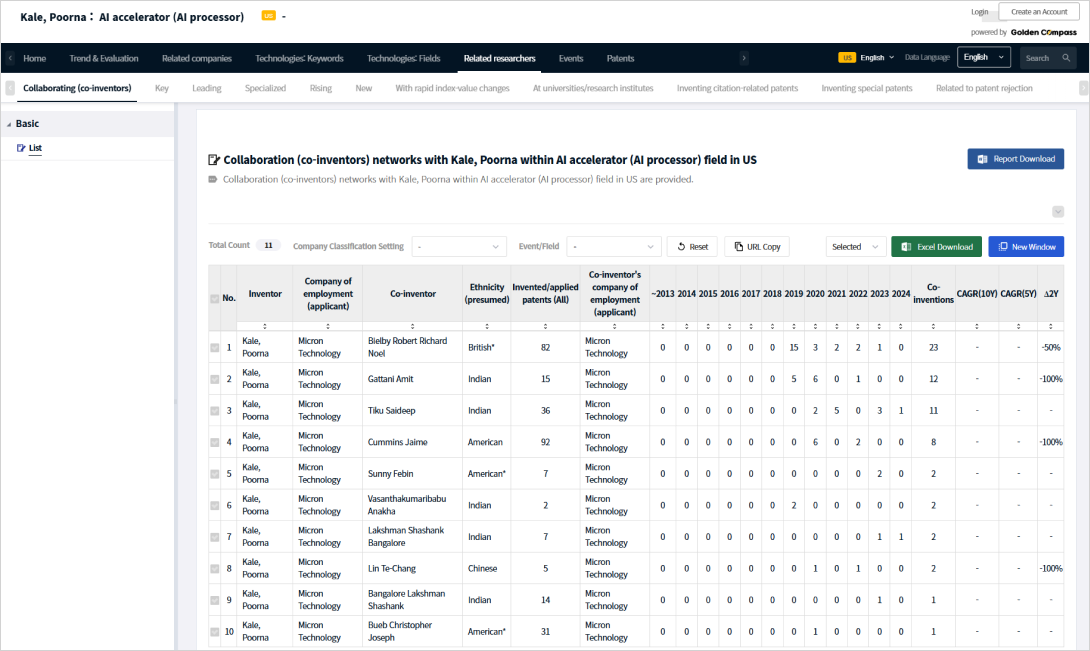
On the other hand, if you wish to explore Kale, Poorna’s overall collaborative research network beyond just the AI semiconductor field, simply click on "Kale, Poorna" at the top left of the screen, then navigate from "1st-depth related researchers" to "2nd-depth collaborating researchers (co-inventors)." By doing so, the network of 28 co-inventors will be displayed, as shown below.
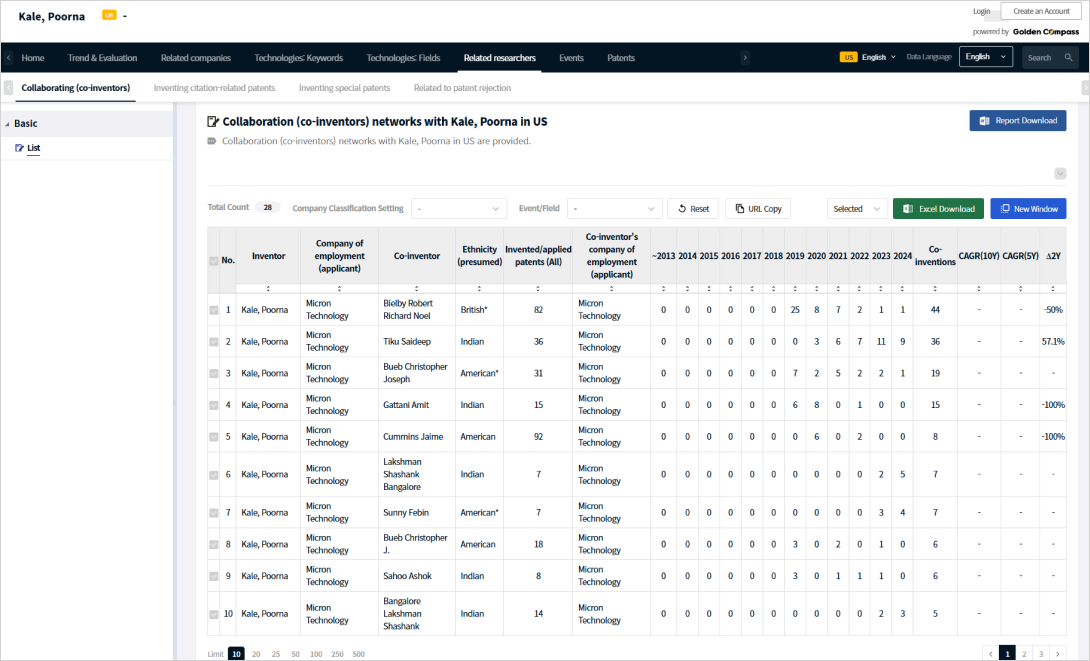
As shown in the example above, PatentPia offers one-click connectivity and analysis between companies, individuals, technologies, as well as between a company's technologies and an individual's technologies. This interconnectivity becomes even more powerful when exploring from companies or keywords.
Interconnectivity Between Information Example Screens
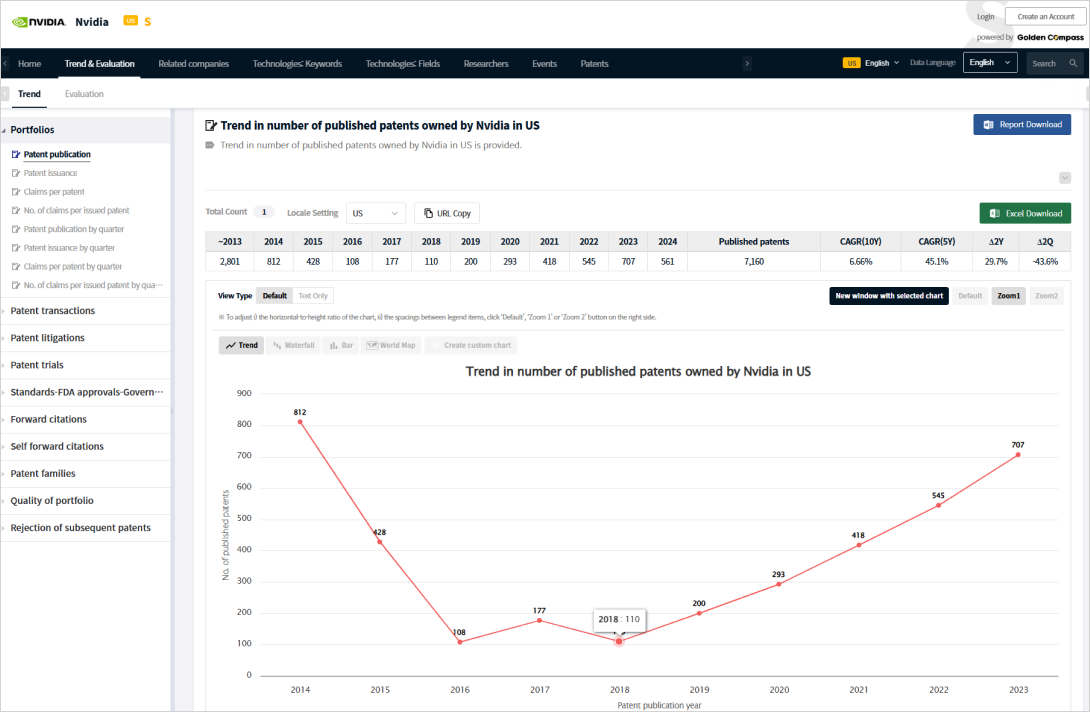
When you click on a specific company (e.g., Nvidia) from the output results based on a given input (e.g., AI semiconductors), the screen transitions to analysis results focused on that company's activities within the selected technology field.
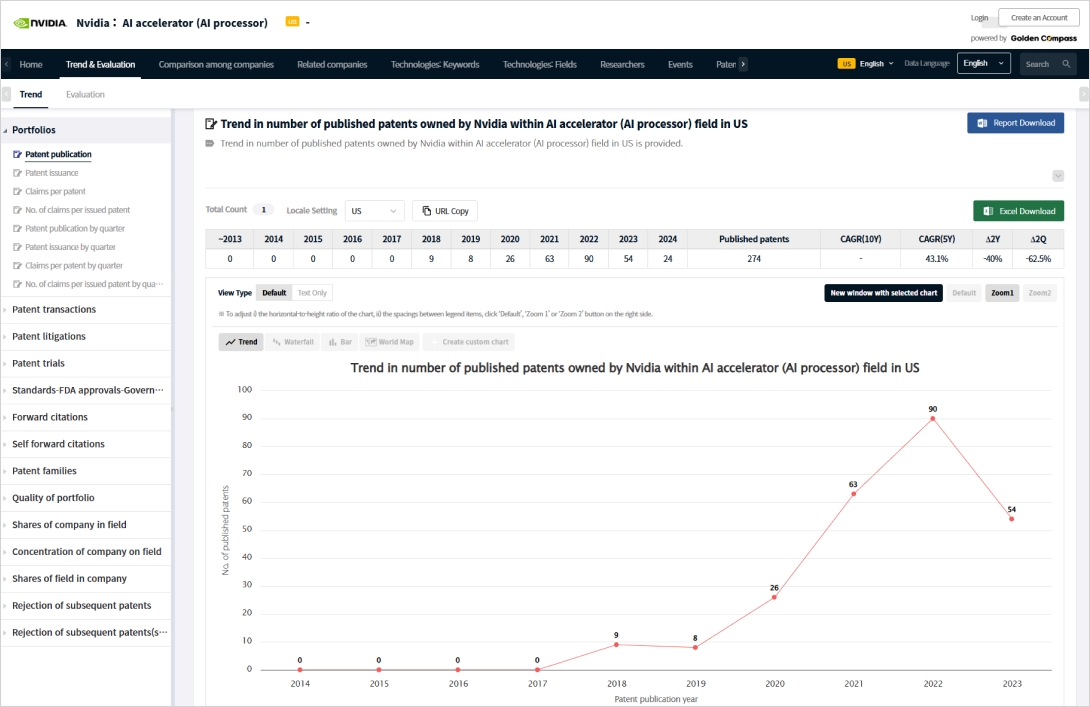
Based on Nvidia's activities in the AI semiconductor field, the 1st-depth menu provides seven categories: (1) Trends, (2) Companies, (3) Technologies: Keywords, (4) Technologies: Fields, (5) Researchers, (6) Events, and (7) Patents.
Convenience Through Visualization
In addition to standard charts, GoldenCompass provides a variety of visualization formats such as 2x2 matrices, wing diagrams, and network graphs.
Company logos are displayed in the visualizations, significantly enhancing usability.
Multiple types of visualizations can be selected for a single analysis result.
Through a URL, not only the initial screen but also the final screen — with applied filters and sorting — can be reproduced and shared.
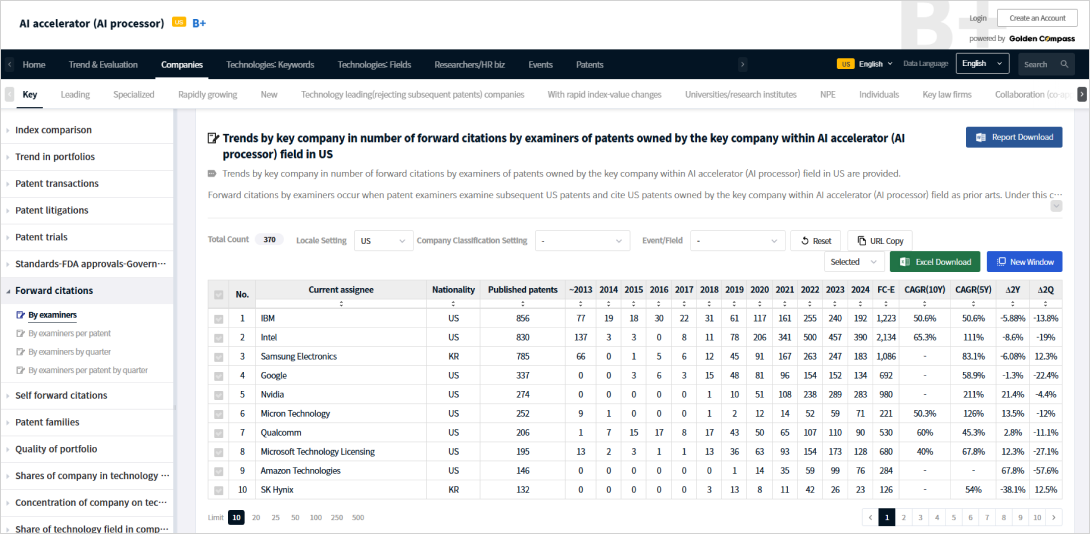
The example below shows analysis data by company holding numerous U.S. patents in the AI semiconductor field, along with the corresponding visualized output.
Convenience Through Visualization Example Screens
Visualization: For a single analysis result, a variety of visualization outputs are provided. Each chart comes with a unique chart URL, allowing users to easily reproduce and share the visualization through the URL.
Link to 2X2 chart → Link to wing chart →MS Word Reports: One-click generation of reports is available, including both one-page reports for a single analysis result and multi-page reports that compile multiple analysis topics into a single document. Multi-page reports can be created by clicking the "Report Download" button under "Home" → "Dashboard."
Example Services
GoldenCompass: Showcasing the Power of PatentPia’s Data
GoldenCompass is a comprehensive platform that demonstrates the versatile applications of PatentPia’s data
Website : https://goldencompass.patentpia.com/en/
GoldenCompass Feature Introduction : Link →
This innovative site highlights how PatentPia’s extensive patent database can be leveraged in new, exciting ways. By combining big data with cutting-edge AI technology, GoldenCompass offers a glimpse of future services that bridge data and intelligence.
Versatile Demonstrations: Explore diverse use cases of PatentPia data in action.
Big Data + AI Synergy: See how combining PatentPia’s database with AI technology unlocks new insights.
Interactive Preview: Visit GoldenCompass to experience prototype services powered by PatentPia’s data.
PatentPia GPT Service
PatentPia GPT is a ChatGPT-style Q&A service designed to help users find companies or experts in specific technology fields. While currently a prototype or proof-of-concept, PatentPia GPT clearly illustrates what is possible when PatentPia’s big data is integrated with advanced AI. This AI-driven service interprets natural language queries about tech fields and delivers targeted results drawn from PatentPia’s extensive database.
Go to https://patentpiagpt.patentpia.com/en/ and type, for example, "Tell me which companies in the United States specialize in quantum computing."
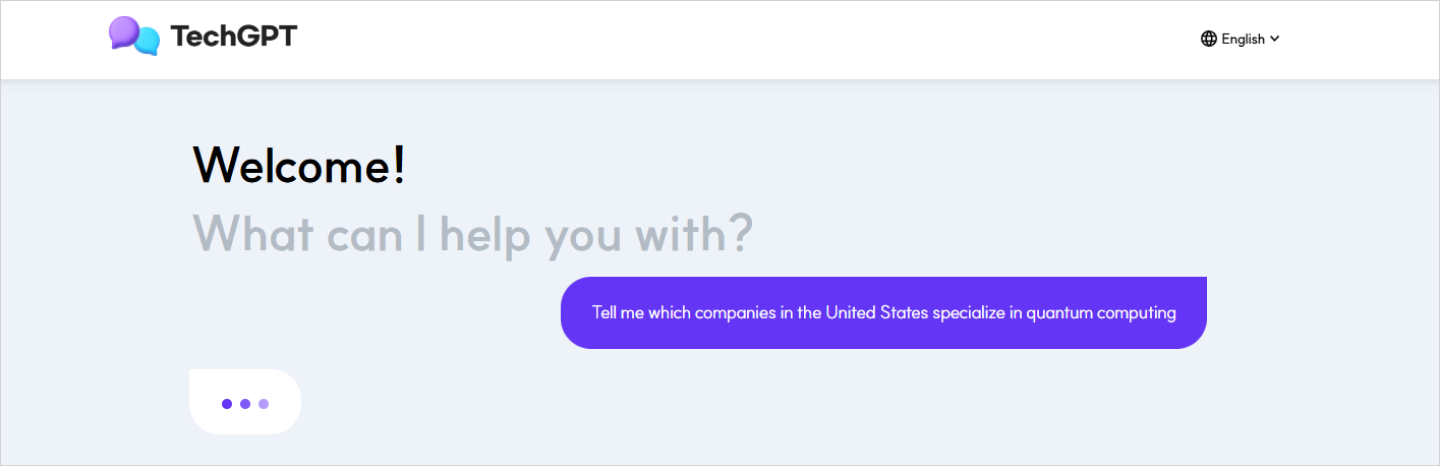
This will result in a multi modal response like the one below.
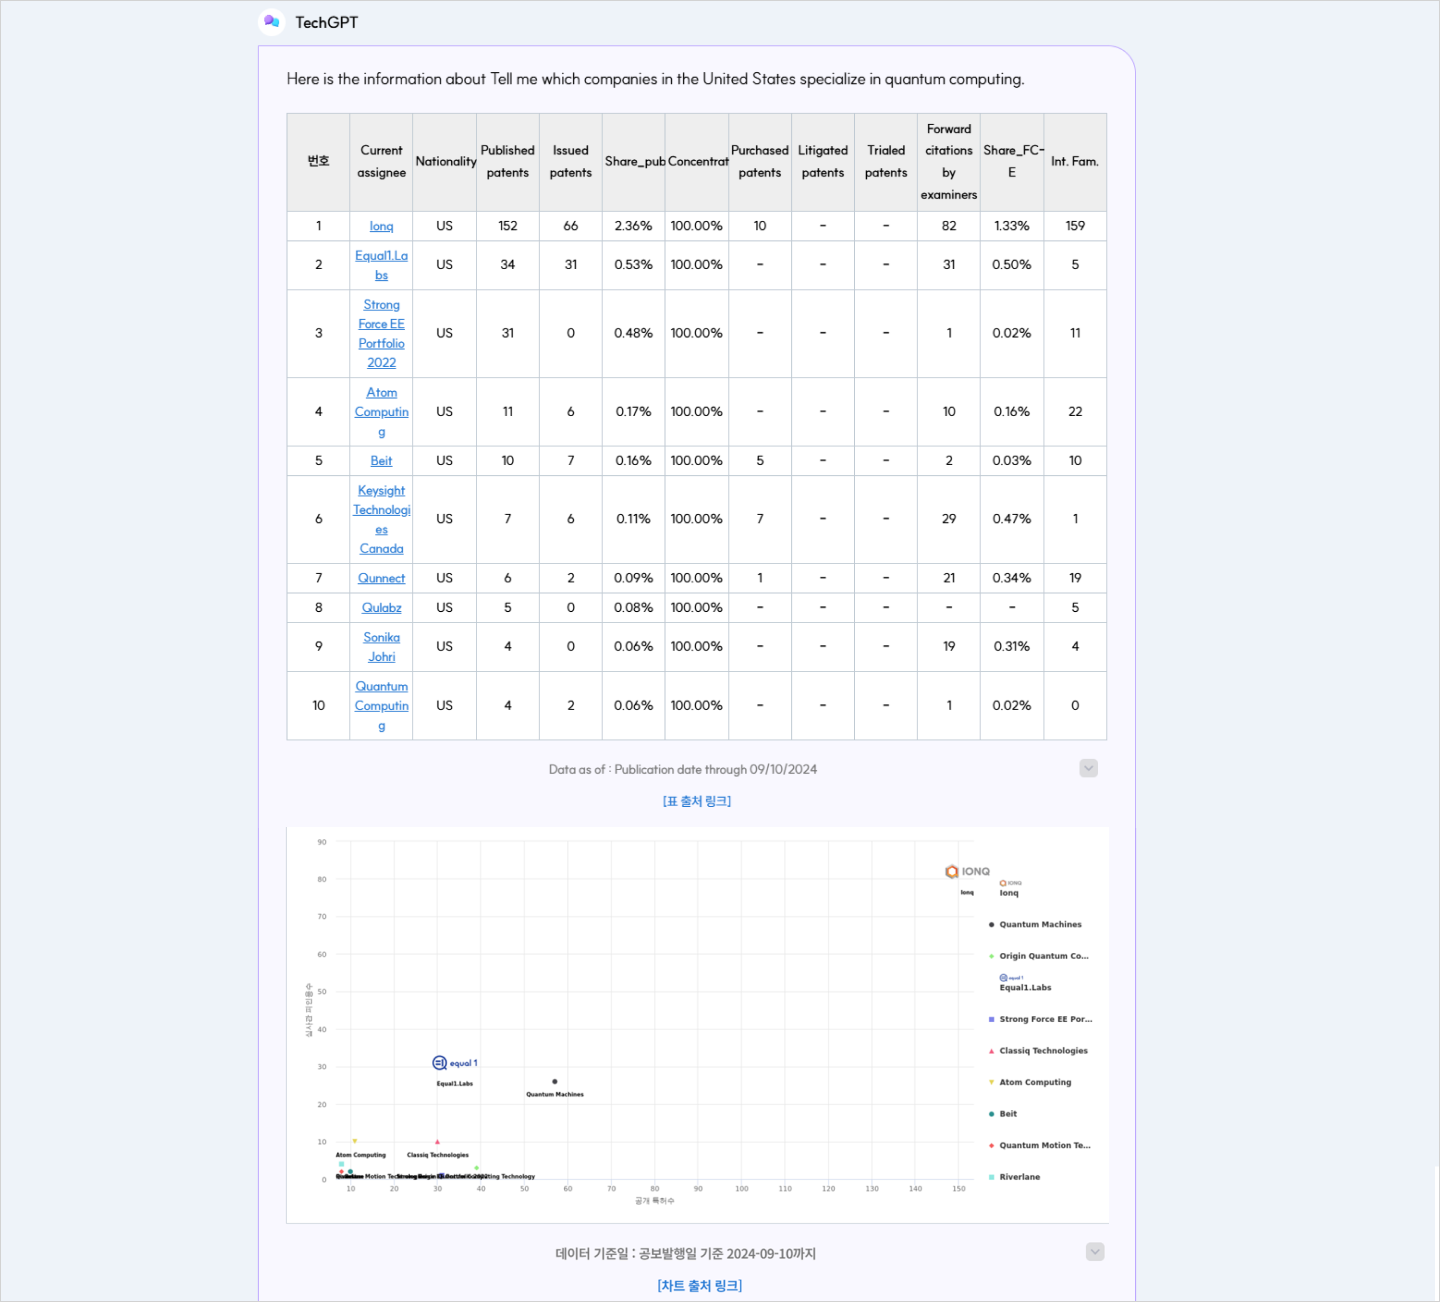
Click the [Link to Table Source] or [Link to Chart Source] at the bottom of the screen to be taken to the GoldenCompass screen. [link to screen]
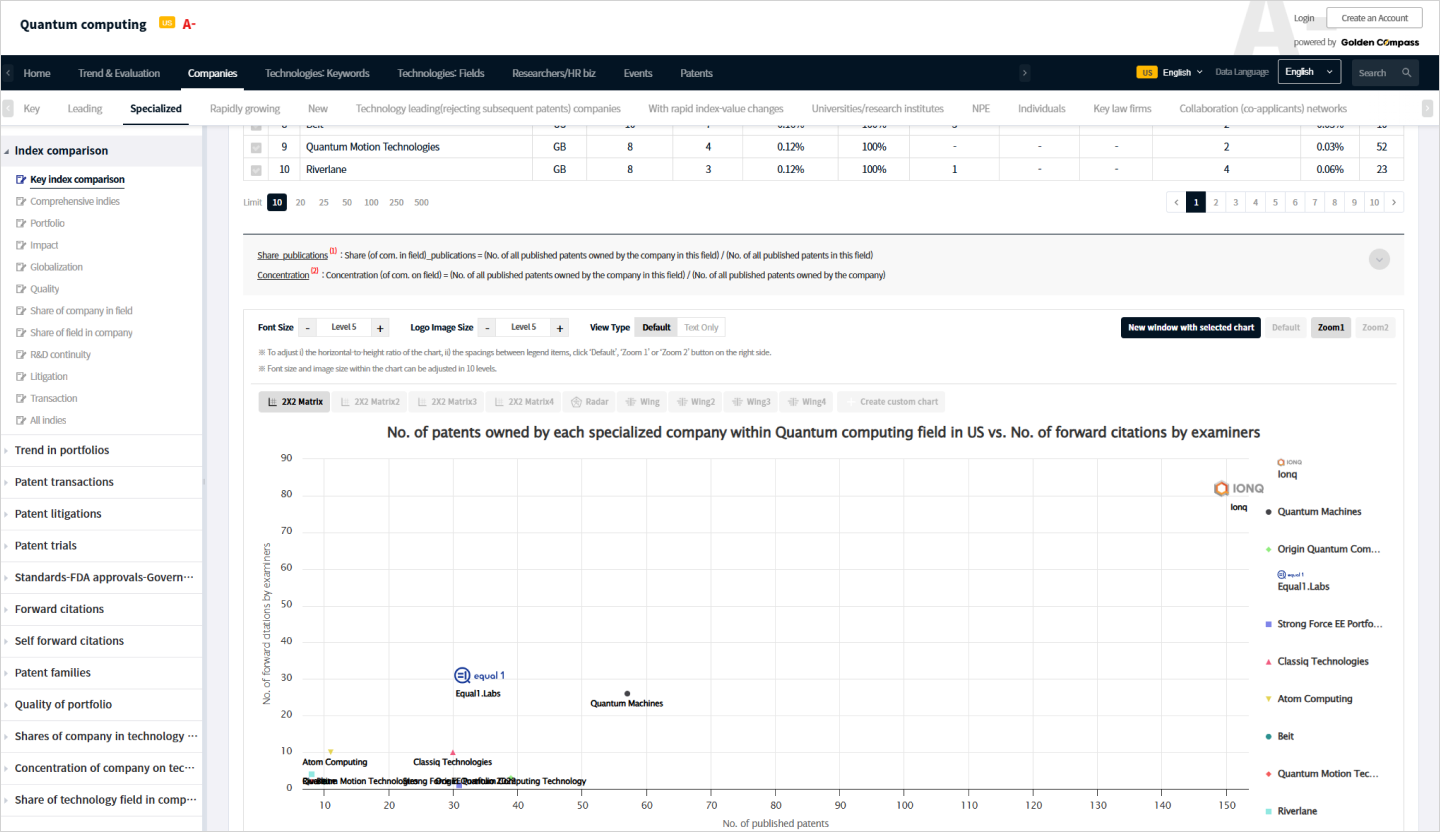
PatentPia GPT transforms natural language questions about technology trends into actionable, data-driven insights. For example, a user might ask, “Which US companies are leaders in quantum computing?” PatentPia GPT then goes through a five-step process to deliver a comprehensive answer. It converts the question into a structured query, generates analysis results (including tables, time-series charts, and 2x2 matrices), and crafts a clear, narrative explanation of the findings (for example, “IBM is a market leader in this field; IonQ ranks 6th; companies X and Y show strong technical competitiveness.”).
Processes PatentPia GPT uses to perform the query-answer service:

Step 1: Natural language queries from users (e.g., tell me which companies in the U.S. specialize in quantum computing).
Step 2: Create a system-processable query that translates the user query into a system query (e.g., technology field: quantum computing, analytical definition example: key companies, analyzed data: indicators, charts: time series and 2X2 matrix) In detail, PatentPia GPT translates the user’s question into a structured query, identifying the technology domain, key companies, metrics, and analysis parameters.
Step 3: Generate analytics results (tables, charts, etc.) for your query. The system crunches massive patent datasets (via PatentPia’s GoldenCompass data) to produce detailed results—tables, time-series graphs, and matrix charts reflecting trends and relationships.
Step 4: Generate natural commentary on the results of your analysis (e.g., ~~The market leader in this space is IBM, ~~IonQ is in 6th place, ~~From a qualitative perspective, companies that are technologically competitive are...)
Step 5: Another natural language queries (e.g., IonQ is a Korean founded company, please analyze IonQ's latest patent purchases and the key Korean researchers at the company).
As a side note, responses for materials are currently unimplemented, and the technologies it recognizes are only available for the 5 million+ items PatentPia provides, making it a proof-of-concept level service that falls short of flexible responses. We hope you see this as an example of the kind of service that can be provided when patent big data is combined with a fine-tuned LLM.
Currently, PatentPia GPT is a proof-of-concept. It answers queries only from PatentPia’s proprietary database of five million patent-related records. While it demonstrates the power of combining a
fine-tuned language model with deep patent big data, it does not yet support fully conversational, flexible Q&A. Consider this a preview of what is possible when LLMs are trained on specialized patent
analytics.
Unmatched Insights vs. Generic LLMsM
Most AI chatbots (like ChatGPT) rely on retrieving and summarizing a handful of documents (via techniques like RAG - Retrieval-Augmented Generation). They cannot replicate the large-scale quantitative analysis that PatentPia GPT provides. PatentPia GPT can crunch an entire patent portfolio or tens of thousands of documents to generate unique market intelligence—capabilities that off-the-shelf models simply don’t have. We even run the same query on both PatentPia GPT and ChatGPT to highlight the difference. PatentPia GPT’s answers leverage proprietary GoldenCompass analytics to deliver insights that generic LLMs lack.
Key Advantages:
Scale & Depth: PatentPia GPT analyzes vast patent datasets (entire national patent portfolios and massive document collections) rather than just a few web sources.
Domain Expertise: Built on GoldenCompass’s rich patent database, our system provides specialized insights into technology domains, companies, inventors, and patents.
Data-Driven Answers: PatentPia GPT delivers responses backed by structured analytics and visualizations (charts, graphs, tables) instead of broad generalities.
PatentPia’s patent big data can supercharge AI and LLM services (ChatGPT, Claude, Grok, Perplexity, etc.) to deliver highly specialized technology insights. Imagine an AI that instantly answers questions about key companies, innovative people, keywords, or patent trends in any technical field—all grounded in solid data. If you represent an LLM platform or a technology-driven enterprise (for example, a company like LG developing advanced AI capabilities) and you need deep patent analytics, let’s connect. Contact us at contact@patentpia.com to explore partnership and sales opportunities.